Nairobi Flood Hotspots Awareness Map
R Leaflet Disaster Risk Public Safety
Overview
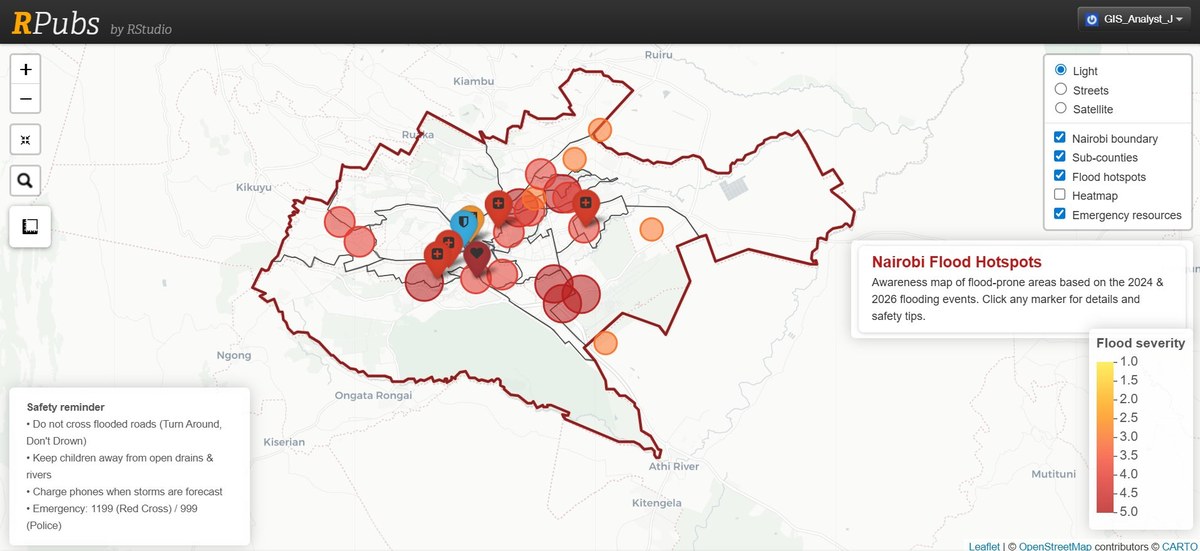
An awareness map of Nairobi's flood-prone areas based on the 2024 and 2026 flooding events, built in R using the leaflet package and published on RPubs for open public access.
The map helps residents, emergency responders, and county planners understand which Nairobi sub-counties face the highest flood risk — and where emergency resources are located.
The Problem
Nairobi experiences destructive flooding nearly every long-rain season, yet public awareness of which specific areas are most at risk remains low. Residents crossing flooded roads is a leading cause of flood-related deaths — a problem that better spatial communication could reduce.
What I Built
An interactive Leaflet map with four layers users can toggle:
- Nairobi boundary — county outline for orientation
- Sub-county boundaries — ward-level administrative units
- Flood hotspots — circular markers scaled and coloured by flood severity (1–5 scale), placed at documented flood-prone locations
- Heatmap — density view of flood risk concentration across the city
- Emergency resources — hospitals and police stations marked for rapid response reference
A Safety Reminder panel is always visible, displaying:
- Do not cross flooded roads (Turn Around, Don't Drown)
- Keep children away from open drains & rivers
- Charge phones when storms are forecast
- Emergency: 1199 (Red Cross) / 999 (Police)
Tools & Methods
| Tool | Purpose |
|---|---|
| R | Data processing and map building |
| leaflet (R) | Interactive mapping |
| RPubs | Open publication |
| 2024 & 2026 flood event data | Hotspot locations and severity |
| Kenya county/sub-county GIS boundaries | Basemap layers |
Impact
The map was designed to be used:
- By residents during storm warnings to understand local risk
- By emergency managers to pre-position resources
- By county planners to prioritise drainage infrastructure
Year
2024 – 2026